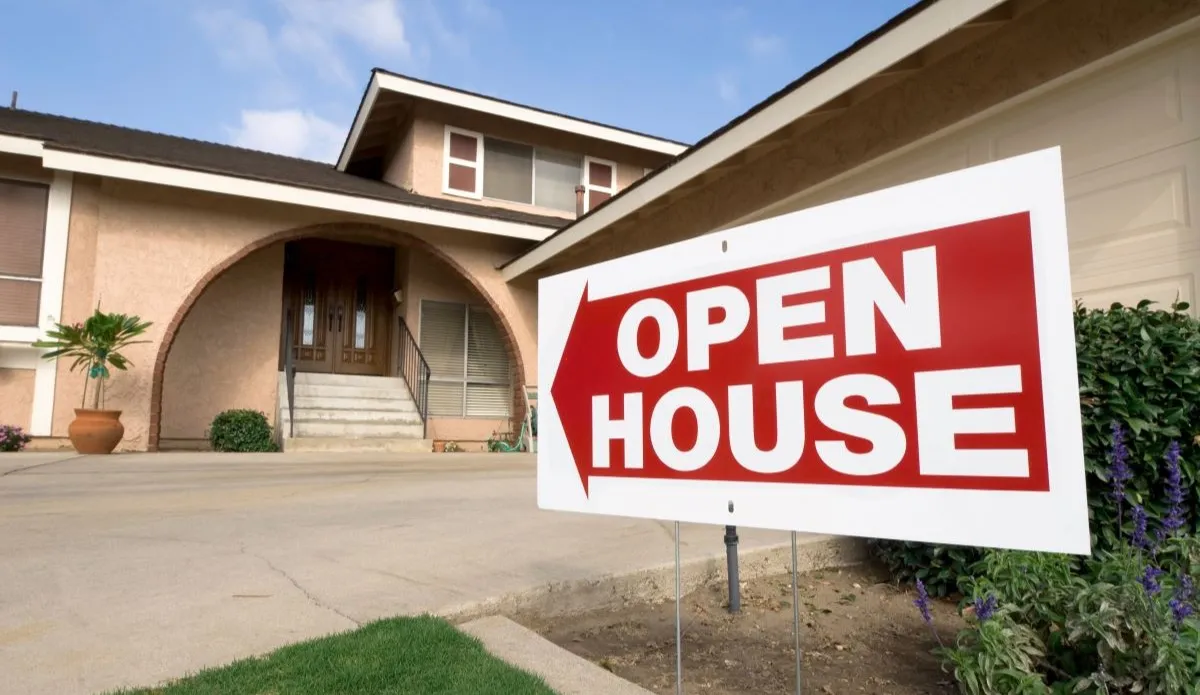


Rental prices are rising in more Hobart suburbs than not. Picture: Supplied
For house renters, finding a home that’s more affordable today than last year will be a challenge.
PropTrack’s new quarterly report shows a substantial shift in the market. Where last year there were more suburbs with shrinking rents than growing rents, now those cheaper suburbs are vastly outnumbered.
Just six suburbs recorded a pricing dip, ranging from 0.8 per cent to 3.8 per cent. Six suburbs experienced no annual growth or declines, while 22 areas posted increases of between 0.4 and 12 per cent.
The largest annual growth was in prestigious Battery Point, which now has a median rent of $700 per week.
The largest quarterly growth was in Eastern Shore suburb Clarendon Vale, where the average house now costs $480 per week. That’s up by about $30 compared to November figures and up $40 compared to the same time last year.

No.18 Colville St, Battery Point 1is priced at $1000 per week, with Arkley & Co. Picture: realestate.com.au
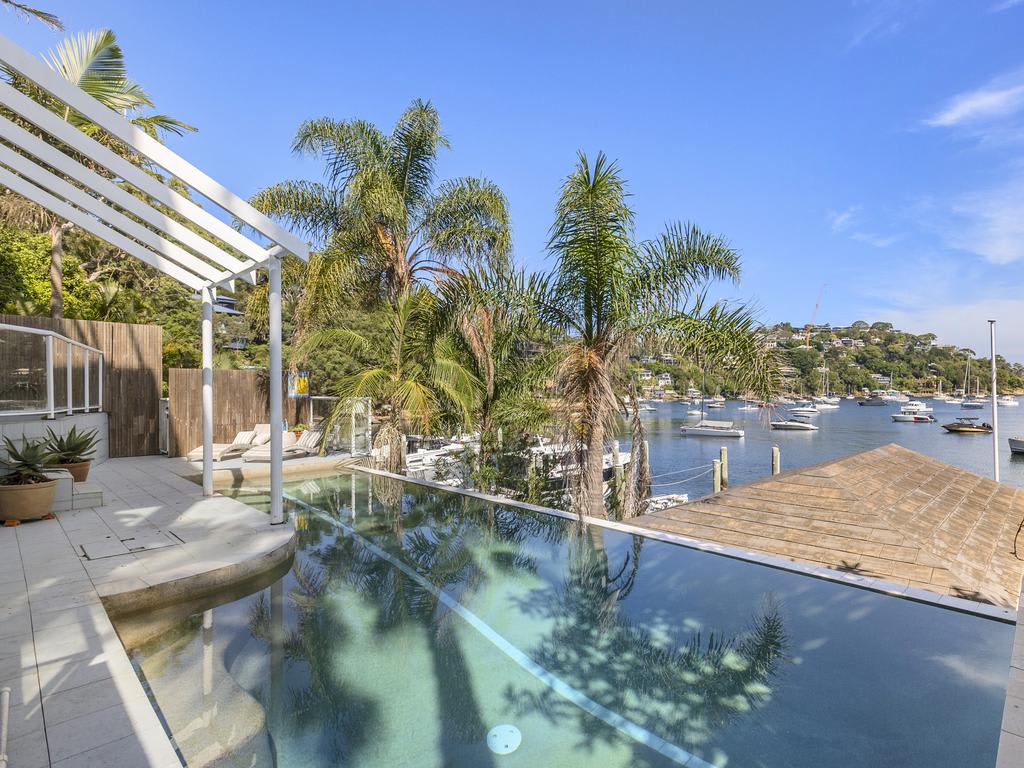
No.2/8 Church St, Kingston is seeking $640 per week, with Raine & Horne. Picture: realestate.com.au
Seven of the 22 unit suburbs analysed in the report showed declining rental asks.
The largest change in units was in North Hobart, where the median dipped from $583 per week last year to $493 today.
The report showed that the cheapest suburb for units was Mount Nelson at $425 per week, followed by Mount Stuart ($430), and West Moonah ($435). Rokeby has the most expensive units at $550 per week.
REA Group senior economist Anne Flaherty said the data showed that the Hobart rental market had “stabilised”.
She said in the areas with the largest changes, it revealed supply constraints.
“In these areas, landlords will recognise that demand, and it will push asking rents higher than in a similar suburb where there are more options available,” she said.
MORE: Queen Mary’s Central Highlands getaway spot for sale
Historic Vernon is Tasmania’s finest home for sale
Luxe lifestyle: Pool, deer farm and a dream garage
REA Group economist Anne Flaherty.
“Things like a university will attract renters to an area. And we typically see higher rents in areas that have a high student population.
“For young people, education and job opportunities are key.
“For families, it might be a balance between liveability — access to schools and childcare centres — alongside proximity to work. These things will attract them to an area.”
Greater Hobart’s median house rent is $550 per week, and $470 for units.
The cheapest house option is 40-minutes out of the city in Primrose Sands ($428 per week), then Bridgewater ($445), and New Norfolk ($450).
Business development manager and real estate agent at Raine & Horne Kingborough, Sarah Woolley. Picture: Supplied
Raine & Horne Kingborough business development manager, Sarah Woolley said finding an affordable family-sized rental for $400 per week or less was “simply no longer realistic or achievable”.
In some areas, $500 to $600 is more likely, she said.
“Rents have risen, as with the cost of living and interest rates, across the board. Our average figures of the past don’t match the current market anymore,” Mrs Woolley said.
“The last quarter of growth reflects the fact that the Hobart market has returned to historic trends of being seasonal, with rents known to increase, and vacancy rates dropping over the warmer months of the year.
“There is generally more movement in the market, more tenants looking and prepared to move, more people arriving from interstate, and thus properties lease quicker.
“This tends to increase demand, and prices rise to match that trend.”
More Real Estate has No.5 Lantana Pl, Primrose Sands listed at $485 per week. Picture: realestate.com.au
Meanwhile, the new Priced Out report from Everybody’s Home showed even Hobart renters earning six-figure salaries can struggle, with 32 per cent of their income dedicated to paying rent.
In a separate PropTrack report, it was revealed that a Tasmanian household earning a median income could afford to rent only one in five homes.
For those on lower incomes, the number of available rentals dropped to “essentially zero”.
| PROPTRACK QUARTERLY RENTAL REPORT FEBRUARY | |||
| HOUSES | |||
| Suburb | Median rent | Quarterly change | Year on year |
| Berriedale | $500 | 0.0% | -3.8% |
| South Hobart | $550 | 0.0% | -2.6% |
| Moonah | $540 | 2.9% | -1.8% |
| Midway Point | $540 | 0.9% | -1.8% |
| Blackmans Bay | $585 | -1.7% | -0.8% |
| Howrah | $590 | 0.4% | -0.8% |
| Mornington | $530 | 0.0% | 0.0% |
| Lindisfarne | $580 | 0.0% | 0.0% |
| Dodges Ferry | $480 | 0.0% | 0.0% |
| Claremont | $500 | 0.0% | 0.0% |
| Chigwell | $480 | 0.0% | 0.0% |
| New Norfolk | $450 | -1.6% | 0.0% |
| North Hobart | $595 | 1.7% | 0.4% |
| Risdon Vale | $460 | 0.0% | 0.5% |
| Kingston | $600 | 0.0% | 0.8% |
| Bellerive | $600 | 0.0% | 0.8% |
| Bridgewater | $445 | -1.1% | 1.1% |
| West Moonah | $548 | 2.3% | 1.4% |
| Primrose Sands | $428 | -2.3% | 1.8% |
| Glenorchy | $550 | 0.0% | 1.9% |
| Brighton | $530 | 0.0% | 1.9% |
| New Town | $610 | 0.0% | 2.5% |
| Sandy Bay | $670 | -1.5% | 3.1% |
| West Hobart | $620 | 3.3% | 3.3% |
| Old Beach | $590 | 0.0% | 3.5% |
| Lenah Valley | $620 | 4.2% | 4.2% |
| Sorell | $550 | 1.9% | 4.8% |
| Lutana | $550 | 0.0% | 4.8% |
| Hobart | $625 | 5.5% | 6.8% |
| Geilston Bay | $600 | 3.0% | 7.1% |
| Clarendon Vale | $480 | 6.7% | 9.1% |
| Rokeby | $528 | 1.4% | 9.9% |
| Austins Ferry | $580 | 0.0% | 10.5% |
| Battery Point | $700 | 3.7% | 12.0% |
| UNITS | |||
| Suburb | Median rent | Quarterly change | Year on year |
| North Hobart | $493 | 1.0% | -15.5% |
| Hobart | $520 | -1.9% | -9.6% |
| West Hobart | $470 | -3.1% | -5.5% |
| West Moonah | $435 | 1.8% | -3.3% |
| Howrah | $490 | -2.0% | -3.0% |
| Brighton | $440 | 2.3% | -2.2% |
| Blackmans Bay | $493 | 1.5% | -1.5% |
| Sorell | $450 | 2.3% | 0.0% |
| Moonah | $450 | 1.1% | 0.0% |
| Lenah Valley | $450 | 0.0% | 0.0% |
| Glenorchy | $450 | 0.0% | 0.0% |
| Claremont | $445 | 1.1% | 1.1% |
| Mount Nelson | $425 | -3.4% | 1.2% |
| Sandy Bay | $480 | 0.0% | 1.6% |
| Lindisfarne | $490 | 3.2% | 3.2% |
| Kingston | $505 | 2.0% | 3.6% |
| Bellerive | $470 | 2.2% | 4.4% |
| New Town | $450 | 0.6% | 4.7% |
| Battery Point | $525 | 5.0% | 5.0% |
| Mount Stuart | $430 | 3.6% | 6.2% |
| South Hobart | $475 | 3.8% | 8.0% |
| Rokeby | $550 | 3.8% | 10.0% |
| Source: PropTrack | |||